Physicochemical and Functional Properties of Tropical Tuber Starches: A Review
Prev Page | Next Page- Introduction
- Extraction Techniques
- Other components in Starch
- Colour and Appearance
- Granule Shape and Size
- Spectral Features
- X-Ray Diffraction Pattern
- Molecular Weight
- Amylose Content
- Thermal Characteristics
- Gelatinisation and Pasting Temperatures
- Viscosity
- Swelling Power
- Solubility
- Clarity
- Sol stability
- Digestibility
- Conclusions
10. Thermal Characteristics
Since the earliest study Stevens and Elton [120], many other workers also have used Differential Scanning Calorimetry (DSC) to investigate starch gelatinisation.
Table 9 : Physicochemical and functional properties of Dioscorea starches
| D.alata | D.Ballophylla | D.dumetarum | D.abyssinic | D.rotundata | D.cayensis | D.esculenta | |
|---|---|---|---|---|---|---|---|
| Amylose content [%] | 21[22] 25.0[80] 30[89] | – | 13.5[30] 15[22.23] 12.3[80] | 29.7[42] | 21.7-24.6[65] 21.1- | 23.6[80] 27[89] | 14[89]; |
| Pasting temp. [0C] | 83[22] 69-88[23] | 75-80[32] | 83[30] | 72.9[42] | 79-97[65] | – | – |
| Sw. vol. [mL/g] | 28-35[8] | – | – | 10(650C)[42] 17(750C)[42] 23(850C)[42] | 15-25[65] 18-22[8] | – | 24-27[48] |
| Solubility [%] | 13-19[8] | – | – | 3.5(650C)[42] 5.5(750C)[42] 11.0(850C)[42] | 10-15[8] | – | 6-01[8] |
| Tonset[0C] | 77.21[133] 73.74[134] 70.2[137] 76.5[80] | – | 78.1[80] | 64.2[42] | 79.02[133] 72.17[134] 71.5[80] | 69.4[80] 65.7[134] | 75.92[133] |
| Tmax[0C] | 81.52[1.33] 74.4[137] 78.8[80] | – | 81.3[80] | 68.2[39] | 83.12[133] 74.8[80] | 2.9[80] | 79.75[133] |
| Tend[0C] | – | – | 86.4[80] | 74.8[42] | 87.95[133] 80.8[134] 80.5[80] | 76.7[80] | 85.68[133] 75.35[134] |
| ΔH [J/g] | – | – | – | 19.2[42] | 10.28[133] 15.01[134] | – | 13.64[133] 13.25[134] |
Table 10 : Physicochemical and functional properties of minor tuber starches
| C.esculenta | Carna edulis | A.paecniifolius | Arrow root | A.xanthorrhiza | X.Saggittifolium | Coleus | P.erosus | Curcuma Sp. | |
|---|---|---|---|---|---|---|---|---|---|
| Amylose content [%] | 14-19.4[64]; 9-17[89]; | 28[94]; 38[41]; 27[89]; 24.2-27.6[66] | 21.9-23.9[91]; 24.5[41]; | 16-27[5] | 1.8[61]; 21.4[61]; | 16-24[5] | 33[36]; | 17-25[5] | 25-28[67] |
| Pasting temp. [0C] | 81-85[64] | 65-70[41] 68-90[23] 73-95[132] 70-97[66] | 75-80[32] | 75-90[132] 79-92[132] | 75-90[132] 79-92[132] | 78-95[138] 85-95[138] | – | – | – |
| Sw. vol. [mL/g] | 25-60[64] | 10.8-14.6[66] 19[29] | 21.5-24.4[91] 3.2(750C)[40] 22.3(800C)[40] 31.5(1000C)[40] | 23[5] | 23[5] | 20[5] | 25[36]; | 25[5] | 19-30[67] |
| Solubility [%] | – | – | 1.4(750C)[40] 17.0(800C)[40] 20.8(1000C)[40] | – | – | – | – | – | 11-23[67] |
| Tonset[0C] | 65.7[134] 75.92[133] | 65.35[134] 63[127] 61.6[132] | 77.8[134] | 68.5[132] | 68.5[132] | 83.11[133] 74.8[134] 66.0[137] 74.0[138] | – | 63.6[134] | 79.7[67]; 74.3[67] |
| Tmax[0C] | 79.75[133] | – | – | 68.5[132] | 68.5[132] | 85.72[133] 69.9[137] 78.0[138] | – | – | 82.7[67]; 76.8[67] |
| Tend[0C] | 75.45[134] 85.68[133] | 70.85[134] 92[127] 74.5[132] | 83.53[134] | 85.0[132] | 85.0[132] | 90.4[133] 79.5[134] 81.8[137] 87.0[138] | – | 76.6[134] | 97.1[67]; 82.1[67] |
| ΔH [J/g] | 13.25[134] 13.64[133] | 16.04[134] 28.8[127] 1.8[132] | 16.6[134] | 4.4[132] | 4.4[132] | 9.08[133] 15.22[134] 12.9[13.7] 3.98[138] | – | 13.65[134] | 16.06[67]; 17.47[67] |
Table 11 : Effect of cetyl trimethyl ammonium bromide on the Blue Values of different Tuber starches.
| Starch | Total amylose [Blue Values] | Soluble amylose [Blue Values] |
|---|---|---|
| Cassava | 0.32 | 0.18 |
| Cassava + CTAB | 0.27 | 0.13 |
| Colocassia | 0.28 | 0.18 |
| Colocassia + CTAB | 0.20 | 0.07 |
| D.esculenta | 0.29 | 0.14 |
| D.esculenta + CTAB | 0.22 | 0.04 |
| D.alata | 0.43 | 0.18 |
| D.alata + CTAB | 0.38 | 0.11 |
| D.rotundata | 0.38 | 0.18 |
| D.rotundata + CTAB | 0.35 | 0.12 |
| Sweet potato | 0.38 | 0.13 |
| Sweet potato + CTAB | 0.34 | 0.09 |
| Xanthosoma | 0.38 | 0.21 |
| Xanthosoma + CTAB | 0.33 | 0.15 |
-
DSC Gelatinisation Temperature
-
Cassava Starch
DSC studies on starch extracted from five varieties of cassava possessing different organoleptic quality [41] showed that varietal differences manifest themselves in the DSC patterns (Tab 4. Fig. 7.). The characteristics peak shape could be traced to structural differences among the varieties. The onset of gelatinisation as indicated by Tonset was earliest for H-165 starch (65.35 0C) and latest for H-97 starch (69.350C). However, Tend was highest for M4 showing the largest range for M4 starch. This is also evident from the broad DSC peak for this starch (Fig. 7). The other reported values for Tonset of cassava starch are presented in Tab. 8 and also show considerable variation. A similar variation in values is found for Tend also. Asaoka et al. [129] have examined the gelatinisation characteristics of four cultivars harvested at different seasons and their results indicated that both genetic constitution and environmental conditions affectedt he DSC parameters. Starch of one cultivar (CM 681-2) consistently displayed the highest gelatinisation temperature through all the harvesting seasons (Tab. 12). Defloor et al. [75] studied the DSC characteristics of five varieties harvested during dry and rainy seasons. They found that although within each planting season for each genotype and for each harvest time, significant differences in gelatinisation temperatures were noticed, no systematic changes as a function of genotype or harvest time was noticed. Starch samples harvested at six months stage in dry season had highest onset, peak and conclusion temperatures compared to that from rainy season, but the reverse was true for the 12, 15 and 18 month harvested tubers. Even the temperature of drying affected the DSC gelatinisation temperature of drying affected the DSC gelatinisation temperatures. Heat-moisture treatment enhanced the gelatinisation values of cassava starch considerably [107]. The gelatinisation parameters of cassava starch extracted using SO2 incorporated water are enhanced by 20C from 59.6 to 62.0 for Tonset and 84.7 to 87.20C for Tend [114].
-
Sweet Potato Starch
Collado et al. [135] have examined the DSC characteristics of 44 sweet potato genotypes from the Philippines and obtained considerable variation in all parameters. The mean Tonset was 64.60C and range 61.3-700C, mean Tpeak 73.90C (range 70.2-770C) and mean Tend 84.60C range being 80.7-88.50C, the mean gelatinisation range being 20.10C with a range of 16.1 to 230C. Garcia and walter [26] have examined two varieties cultivated at different locations and found the range to be between 58-640C for Tonset 63-740C for Tpeakand 78.830C for Tend . While the selection index did not affect the values, location influenced the parameters. Slightly lower values for these parameters have been reporte by other scientists [23, 115, 130, 136]. Noda et al. [63] found varietal difference but no effect of fertilization on the DSC characteristics of two sweet potato varieties. It was also found that during the growth period, the Tonset was the lowest at the latest stage of development. Valetusdie et al. [137] have compared the gelatinisation temperature of starch from fresh tubers and freeze dried sweet potato tuber gave nearly equal values (67-730C), but the small granules gelatinized between 75 and 880C. Similar results were obtained for Xanthosoma and D. alata starches also. They also studied the effect of the tuber extracts or sucrose solutions on the gelatinisation temperature and found that the extracts and sucrose at 12% concentration enhanced the gelatinisation temperature considerably.
-
Other Starches
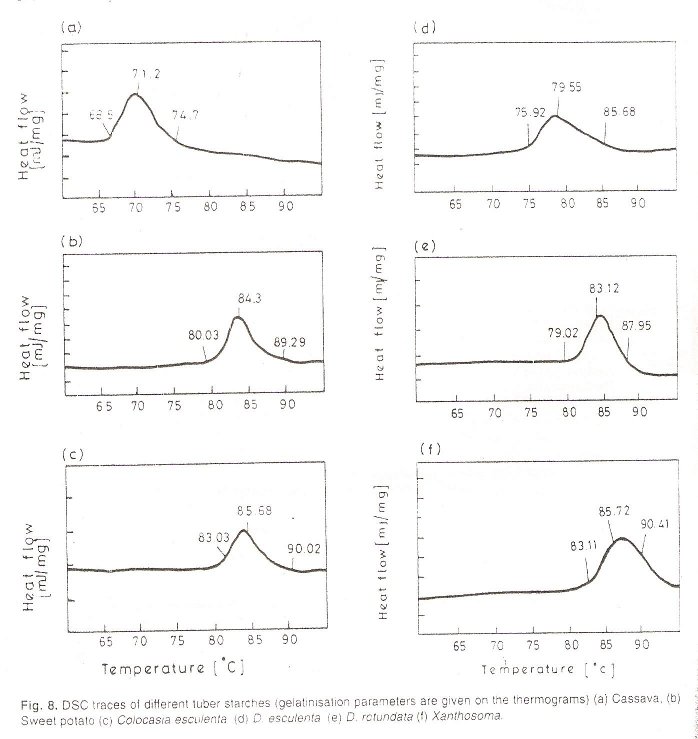
The DSC data on other tuber starches is presented in Tabs. 9 and 10 and Fig. 8. Considerable variability in the values is observed. We found large difference between the values obtained in two different studies for the same starches [133,134] .Compared to cassava and sweet potato starches these starches generally had higher Tonset and Tend values. Highest values were noticed for Colocasia starch and the other starches had values in between. For colocasisa starch, we obtained Tonset values of 83.20C [133] and 79.90C [134]. The corresponding Tend values were 90.0 and 85.00C, respectively, these being the highest among the starches. For Amorphophallus starch, the values were 77.80C for Tonset and 83.50C for Tend.
DSC data of the starches from the two Curcuma varieties indicated that the gelatinisation peak of C. malabarica starch was doublet and the peak splitting may be attributed to possible structural differences in the starch [67]. The onset of gelatinisation was earlier for C. malabarica starch whereas Tend was nearly similar for the two starches. The higher Tonset for c. zedoaria starch also indicates the possibility of Curcumin forming complexes with starch molecules. The range of gelatinisation was higher (17-220C) for Curcuma starch and similar to yam and potato starches. This can also be attributed to the presence of phosphate linkages in these starches. The Tonset values of both starches were similar to those of yam starches (75-800C) but higher than that of cassava starch (65-690C). The Tpeak values also showed a similar trend Tend values and consequently the range of gelatinisation were found to be higher for Curcuma starch. Heat-moisture treatment enhanced the gelatinisation temperature of arrowroot starch considerably [107].
Table 12 : Physicochemical and functional properties of cassava starch from tubers harvested in different periods
Cultivar Harvested month Tonset
[0C]Tend
[0C]ΔH [J/g] Swelling Power Solubility RVA[SNU] Brabender data [BU] 600C 700C 800C 600C 700C 800C PV break down Set back PT [0C] PV V0.5 HMC-1 March 53.2 63.8 8.4 – – – – – – – – – – – – August 53.6 63.5 6.8 19.8 30.6 39.4 9.1 15.8 19.0 567 405 132 59-69 680 340 November 50.7 60.5 7.6 22.6 32.0 43.0 9.6 17.0 19.9 559 403 137 58-62 820 310 CM 489-1 March 55.4 64.6 8.8 – – – – – – – – – – – – August 54.8 63.7 7.2 17.6 27.7 38.7 7.5 14.4 19.6 590 437 137 60-70 720 360 November 50.9 59.8 7.6 20.6 27.7 34.8 9.5 15.9 19.3 629 479 140 58-66 725 340 CM 681-2 March 57.6 67.2 8.4 – – – – – – – – – – – – August 57.7 67.2 7.6 17.0 31.1 40.9 10.0 17.4 19.9 487 344 142 62-72 635 320 November 54.1 63.9 8.0 19.0 27.7 35.5 11.3 17.8 19.6 557 416 124 61.72 660 335 CM 1559-5 March 55.0 64.6 8.4 – – – – – – – – – – – – August 54.6 64.1 6.8 20.2 30.3 40.9 9.3 15.3 18.4 567 412 144 60-70 750 370 November 51.0 60.2 7.6 21.0 29.3 43.6 8.9 15.6 18.8 624 472 145 58.95 795 335 The differences in the gelatinisation temperatures among the various tuber starches can be traced to the variation in the starch inter molecular bonds. High temperature of gelatinisation can be an indication of the higher stability of the starch crystallites in the starch molecules, which means that more heating is required to swell the granules. In addition, a number of other factors like varietal differences, environmental conditions and the experimental protocols like level of moisture, sample preparation, rate of heating and instrument used contribute to the differences in values.
-
-
Gelatinisation Range
The range of gelatinisation is also quite different among the different starches. In our study, we obtained the highest range for cassava starch (12.90C) and the lowest for Xanthosoma starch (4.70C) [134]. Higher range has been attributed to a higher level of Crystallinity, which imparts higher structural stability so that the water molecules need longer time to penetrate the crystalline areas [139,140]. Billiaderis et al. [126]. Tester and Morrison [141] and Leszkowiat et al. [142] have suggested that higher transition temperatures indicate more stable amorphous regions and lower degree of chain branching. There does not appear to any relation between the XRD pattern and gelatinisation range, as both cassava and Xanthosoma have ‘A’ pattern but the range of gelatinisation is far different. An ‘A’ XRD pattern indicates closer packing and should result in a higher range of gelatinisation. But such an effect is not observed. In addition, the Tonset does not appear to be influencing the range of gelatinisaiton in any regular pattern: granule size and Gelatinisation range also do not show any relationship. In the Brabender Viscographic curves, the yam starches show a longer gelatinisation range, which does not appear in the DSC. The different in the water starch ratio between Viscography and DSC may be the reason for this anomaly.
-
Gelatinisation Enthalpy
Gelatinisation enthalpy depends on a number of factors such as Crystallinity intermolecular bonding, etc. For cassava starch, values range all the way from 4,8 [132] to 16J/g (Tab.8 )[120]. The low value of 4.8[132] appears to be mistakenly reported as J/g instead of cal/g. The enthalpy of gelatinisation of five varieties of cassava varied from 10.6-13.8 J/g [41]. Gelatinisation enthalpy was also found to depend on genetic and environmental factors as illustrated by Asaoka et al. [129] and Defloor et al. [75] from studies using different varieties, time of harvest and seasonal variations. SO2 treatment was found to enhance the gelatinisation enthalpy of cassava starch from 18.1 to 19.1 J/g [114]. For sweet potato starch, the values for gelatinisation enthalpy have been reported to be between 10-18.6 J/g [23, 36, 100, 115, 135]. Effect of variety and environmental conditions was also evident [26, 63]. During the grown period, the ?H was lowest at the earliest stage of development in two sweet potato cultivars and the enthalpy ranged between 11.8-13.4 J/g [84].
Table 13 : DSC Characterstics of the hydrothermic transition of purified starches and fresh and freeze-dried and parenchyma tuber cells.
Tonset[0C] Tmax[0C] Tend[0C] ?H[J/g] Sweet potato Starch 67.3 72.7 79.6 13.6 Fresh tubers 67.4 73.5 80.1 6.8 Freeze-dried tubers 67.8 73.2 81.5 9.3 Small starch granules 75.6 82.6 88.3 15.3 Tania Starch 66.0 69.9 81.8 12.9 Fresh tubers 66.5 70.5 83.6 6.1 Freeze-dried tubers 67.2 70.2 84.2 8.8 Yam Starch 70.2 74.4 80.9 20.9 Fresh tubers 70.1 74.6 82.6 12.3 Freeze-dried tubers 70.4 74.1 83.8 16.2 The gelatinisation enthalpy for other starches is listed in Tab. 9 and 10 and again illustrates the considerable variability among the reports. There does not appear to be any relationship between the enthalpy and other factors like amylose content, granule size and XRD patterns. Since amylopectin has a more crystalline nature, higher amylopectin content has been considered to be contributing to higher enthalpy of gelatinisation. However, such an effect is not evident in any of the studies. Again the differences do not reflect also demonstrate that unlike the gelatinisation temperatures, which show wide variation, the enthalpy of gelatinisation is within a small range for the tuber starches.
Figure 8
-
Starch Retrogradation
DSC has been quite useful in studying retrogradation properties of starches. It has been established that amylopectin can also take part in the retrogradation by the association of the outer chains [49, 143-145]. Retrogradation parameters of tuber starches have been examined by DSC, but the results were quite erratic and hence diffcult to arrive at definite conclusions [134]. The values for Tonset showed a very wide range from 370C to 580C, highest and lowest being for arrowroot and Xanthosoma starches, respectively. It is well known that retrogradation brings about drastic reduction of Tonset of starches. The highest reduction was observed for Amorphophallus and lowest for D. esculenta starches. The range also varied widely from 12.20C for cassava to 430C for D.alata. the wide range in values indicates that the retrograded starch contains recrystallised amylopectins of different Crystallinity . Among the starches D.alata starch appears to have the maximum variability in crystalline structure. Silverio [143] has reported a value of 430C for potato starch. As expected, the enthalpy of gelatinisation also fell during retrogradation, the reduction being 2.5-fold to 7-fold. No relationship could be derived from the properties of retrograded starches with those of the non-retrograded starches [134].