Cassava Fermentation and Associated Changes in Physicochemical and Functional Properties
Prev Page | Next PageB. Titrable Acidity
As can be expected, Titrable acidity also undergoes changes during fermentation. However, it is difficult to compare the data published, as the units used for expressing the values are different. The acidity has been expressed as percent lactic acid or total acidity percent. The acidity in fermenting mash and the gari prepared therefrom was compared at 24 h intervals and a regular increase was noticed28 (Table 8). The addition of dextrose at various levels led to a lag phase of 8 h followed by a continuous increase in acid content at 48 h, suggesting that sugars are not limiting factor in gari fermentation.61 Akinrele found that the gari quality could be related to total acidity, the most acceptable being one with an acidity of 0.92% ( expressed as lactic acid), compared with 0.40% for the poor quality gari.14
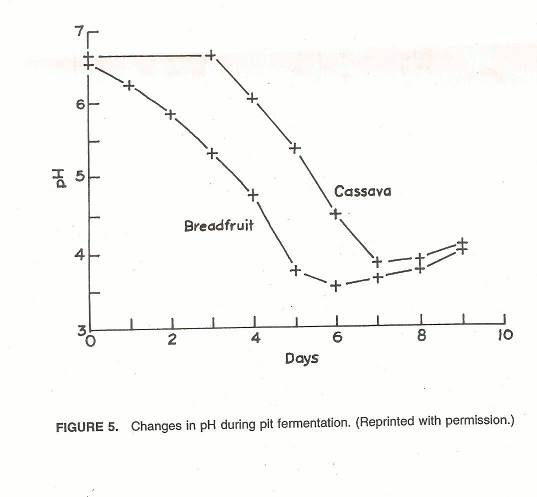
Changes in pH during pit Fermentation

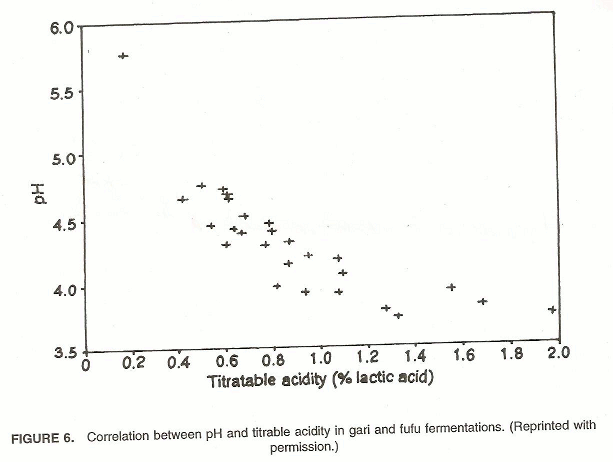
Correlation between pH and Titrable acidity in garl and fufu fermentations

A correlation between total acidity and pH during fufu and gari fermentation was noticed68 (Figure 6). The increase in titrable acidity during fufu fermentation at different temperatures was examined.15 The total acidity by HPLC and lactic acid equivalent were both enhanced to very large extent during fufu preparation; however a further increase during storage was negligible. The effect of temperature during soaking was not appreciable (Table 9). The increase in total titrable acidity during fufu fermentation was highest with Lactobacillus plantarum among the different cultures examined32 (Table 10). The titrable acidity could be correlated with the microbal load during Lafun fermentation10 (Figure 7).
The titrable acidity was compared between closed and open systems, and the value from the open experiment was about twice that of the closed system.16 In our laboratory, it was observed that the total acidity increased during fermentation of cassava tubers with mixed culture inoculum.44
Table 9: pH and TTA of Fufu samples during Processing and storage
| Storage | ||||||||
|---|---|---|---|---|---|---|---|---|
| Soaking treatment | Acidity | Soaked Mash | Fresh Fufu | 1 week | 2 weeks | 4 weeks | 8 weeks | 12 weeks |
| 350C for 24 h | pH | 5.05 | 4.28 | 3.81 | 3.83 | 3.87 | 3.82 | 3.83 |
| TTA | 3.6 | 7.1 | 12.6 | 13.3 | 13.3 | 14.1 | 12.4 | |
| 300C for 48 h | pH | 4.47 | 4.26 | 3.91 | 3.94 | 4.03 | 4.47 | 4.53 |
| TTA | 5.4 | 7.4 | 11.4 | 11.7 | 11.3 | 9.2 | 9.3 | |
| 250C for 72 h | pH | 4.30 | 4.26 | 3.93 | 3.94 | 3.94 | 3.97 | 3.99 |
| TTA | 6.5 | 6.7 | 11.0 | 11.9 | 11.3 | 11.7 | 11.2 | |
| 200C for 96 h | pH | 4.60 | 4.54 | 4.08 | 4.00 | 4.00 | 3.92 | 3.86 |
| TTA | 4.7 | 4.8 | 8.1 | 10.1 | 10.1 | 12.9 | 12.4 | |
Note: Values are the average of duplicate determinations and TTA is expressed as lactic acid equivalents (g kg-1) on a wet weight basis. Samples were soaked and then stored at the temperature indicated in the first column.
Source : Blanshard et al.68 with permission.
Table 10 : Effect of Different Cultures On Titrable Acidity During Fufu Fermentation
| Culture used | Titrable | acidity | (% lactic acid) |
|---|---|---|---|
| Initial (0 h) | Final (96 h) | ||
| L.plantarum | 0.072 | 0.250 | |
| Bacillus subtillis | 0.072 | 0.128 | |
| Klebsiella sp. | 0.072 | 0.125 | |
| Candida krusel | 0.072 | 0.126 |
Adapted from Oyewole.32


